

Soil Temperature

Volumetric Water Content
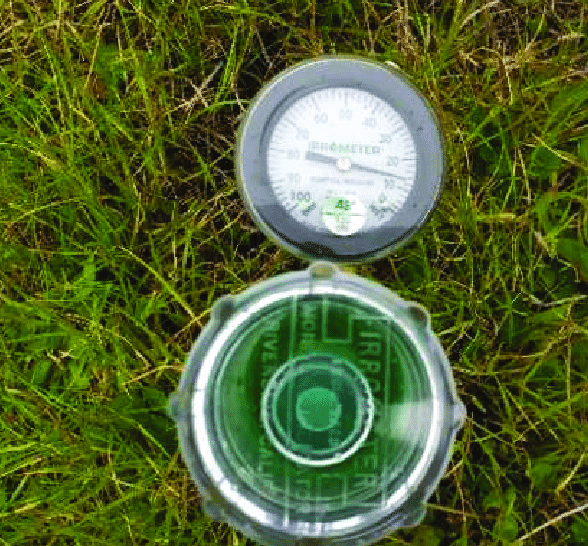
Water Potential
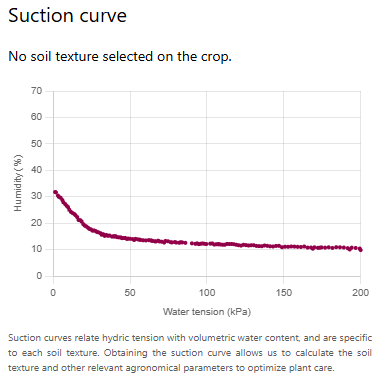
Suction Curve
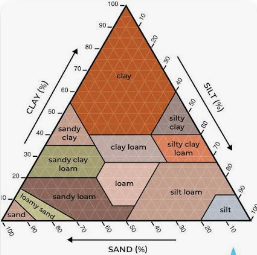
Soil Texture
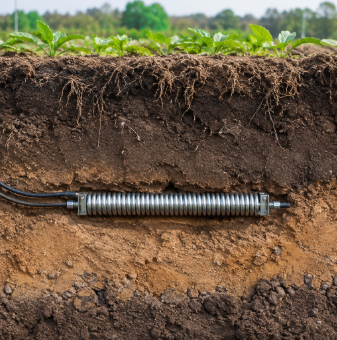
Apparent Electrical Conductivity
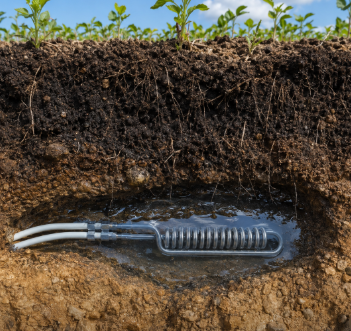
Pore Water Electrical Conductivity
ACCURATE DATA IN REAL TIME
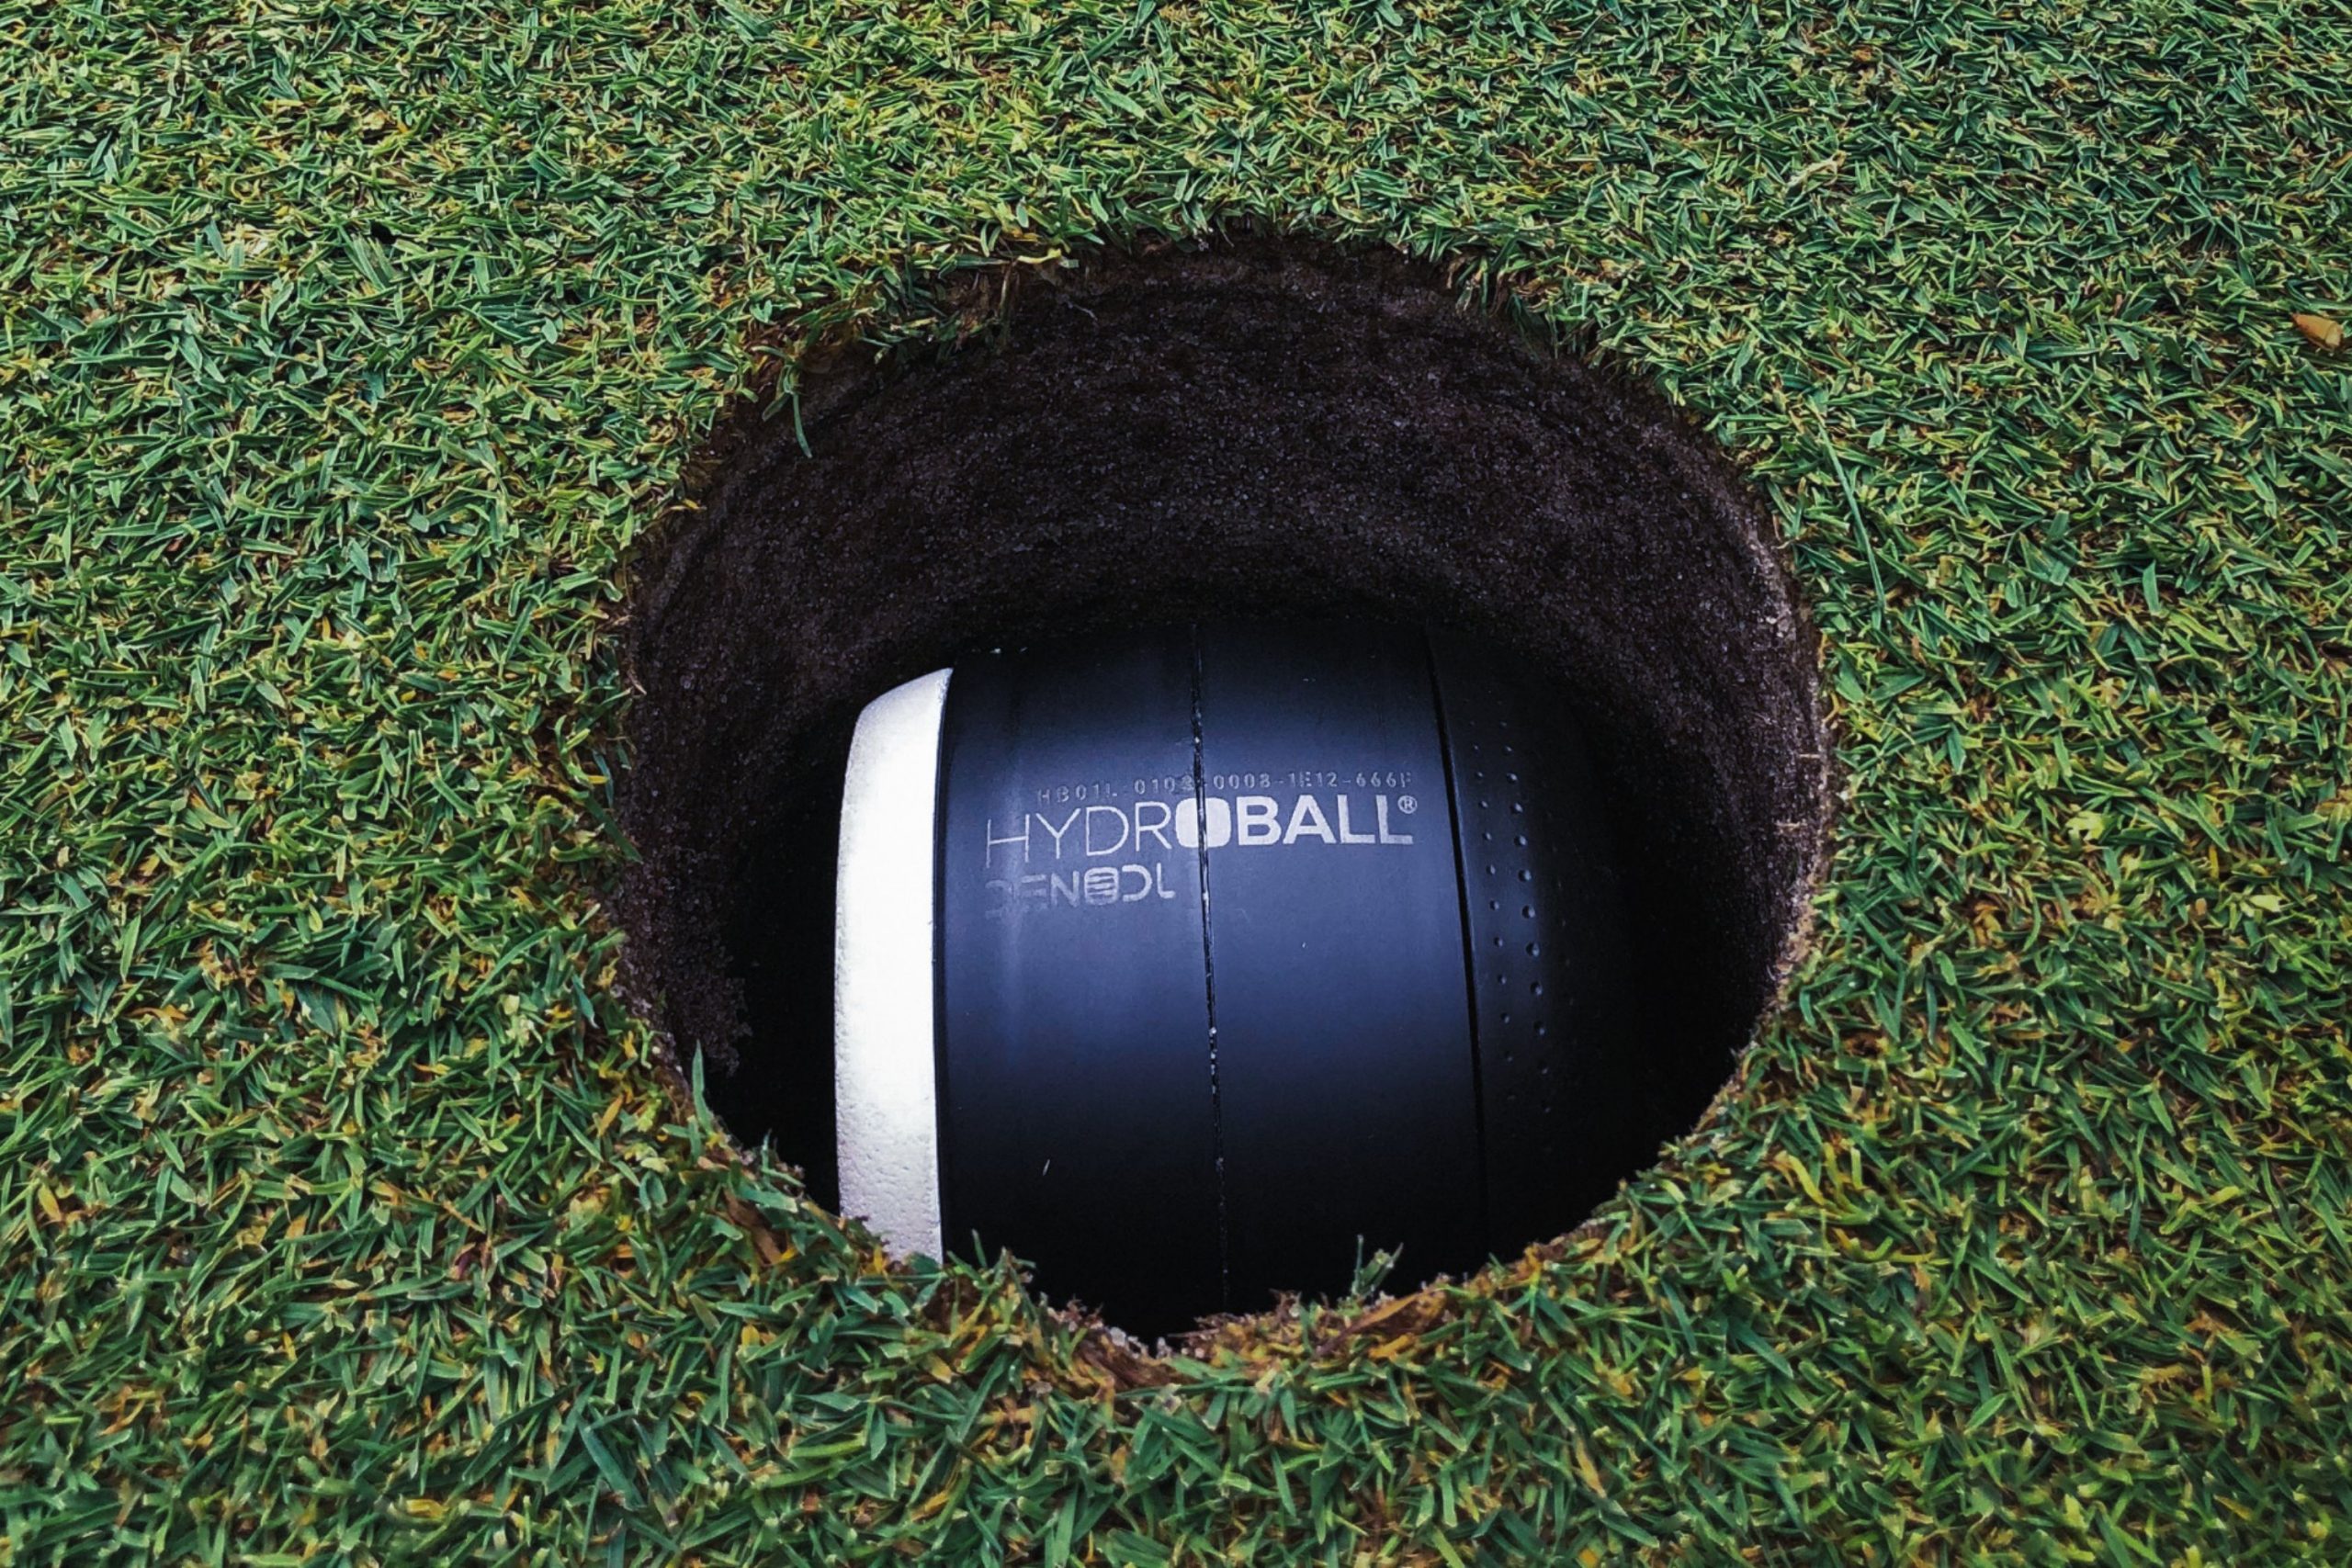
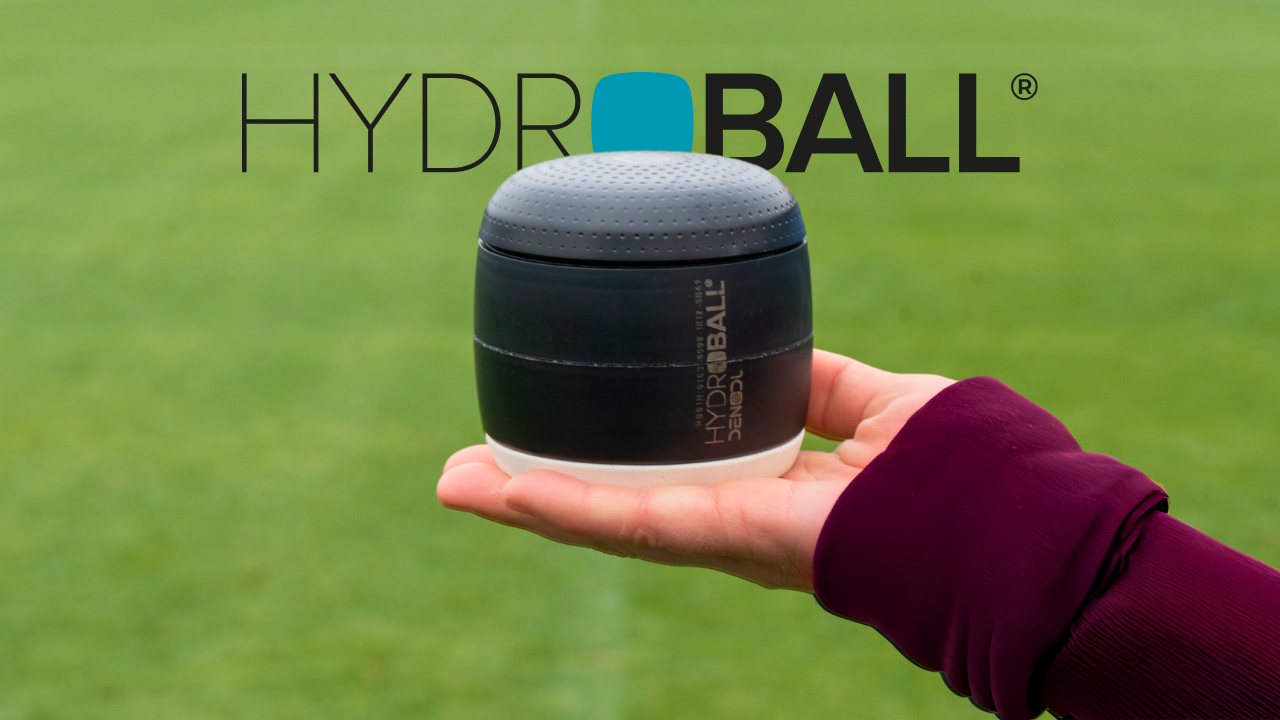
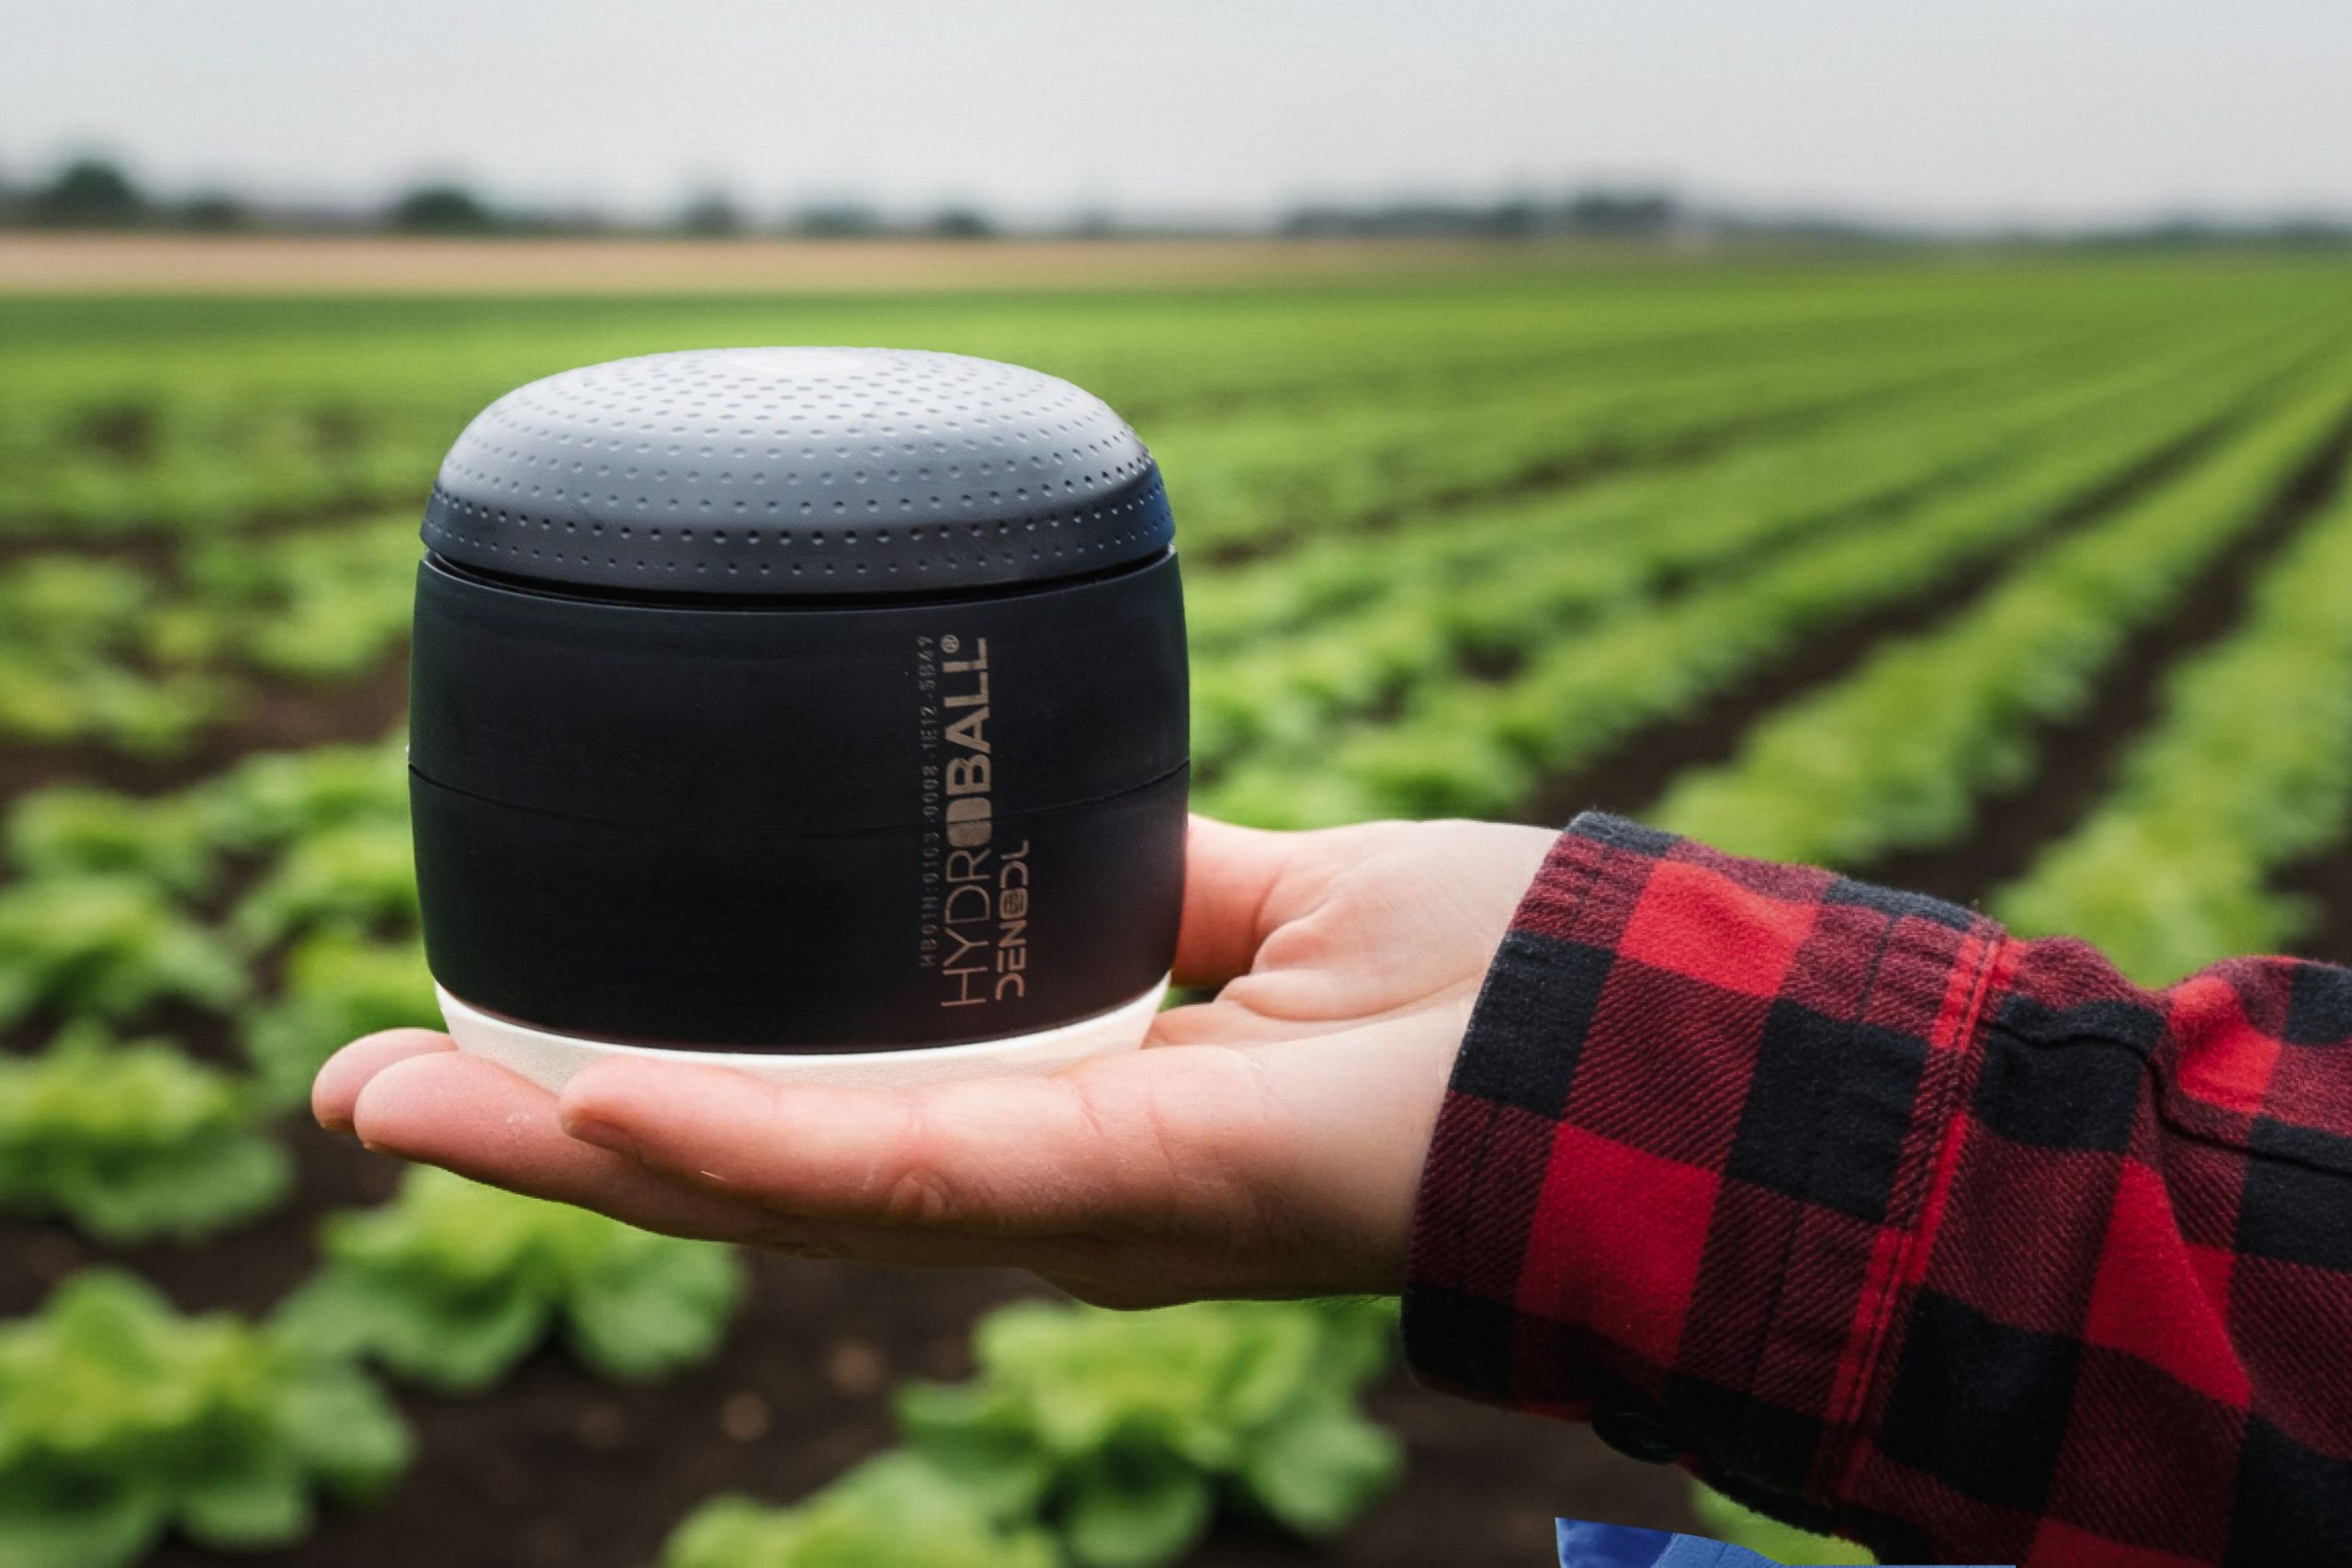
HYDROBALL® is the smart irrigation probe designed to transform water management by increasing productivity and reducing costs. It is the only sensor on the market that monitors up to five key soil parameters, providing accurate and accessible real-time data.
HYDROBALL® helps reduce water consumption by up to 40% and enables the optimization and improvement of efficiency, quality, and crop productivity.
- Simplicity, robustness, and versatility.
- Real-time certainty.
- Improved productivity and crop quality.
- Sustainable contribution.
- Practical design and accessible technology.
- Small, autonomous and robust.
In a world where water is a critical resource, HYDROBALL® leads the shift toward efficiency and sustainability. Our mission is to deliver advanced solutions that enable farmers, sports turf managers, and urban planners to make smarter, data-driven decisions.
BENEFITS
DATA-DRIVEN CERTAINTY
Provides accurate real-time information, minimizing uncertainty in a sector affected by climate and economic volatility.
EXTENDED VERSATILITY
Adapts its functionality to three key sectors, from large agricultural operations to sports fields and urban parks.
QUALITY AND PRODUCTIVITY
Thanks to the data collected, production is optimized, ensuring quality and improving plant performance.
ECONOMIC ACCESSIBILITY
Up to 5 times more cost-effective than market alternatives, with a fast return on investment.
TOTAL AUTONOMY
Easy to install, with no cables or data loggers, and a battery life of 2 to 3 years.
Users can choose between the LoRaWAN and NB-IoT/LTE-M versions for direct connectivity to the cellular network.
AUTOMATED OPTIMIZATION
Generates irrigation recommendations using AI, cross-referencing meteorological and soil data to maximize efficiency.
SOIL WATER RETENTION CURVE
At the Digital Twin Management Unit level, an Agronomic Analysis section is available.
This section displays the soil water retention curve for each monitored location. The curve represents the relationship between soil water content (Volumetric Water Content, %) and matric potential (Water Potential, kPa), providing valuable information about the soil’s ability to retain water.
Additionally, this section allows you to compare your soil’s water retention curve with the twelve standardized USDA soil curves, classified according to their texture. It also provides the theoretical soil water retention parameters, including Saturation Point, Field Capacity, Refill Point, and Permanent Wilting Point.
In other words, you can compare your soil’s water retention capacity with that of the twelve standardized USDA soil types. This enables you to estimate the theoretical Volumetric Water Content (%) corresponding to the Saturation Point, Field Capacity, Refill Point, and Permanent Wilting Point, helping you better understand your soil’s water dynamics and optimize irrigation management.